The tips of the sunset’s orange light begin caressing the beach sand, with a soft mist in tow. The mist grows denser, soon enveloping the shoreline and adjacent palm trees. A dark shadow rises, growing larger and larger, as if something were approaching the shore, however it is impossible to judge the distance due to the dense fog. It soon becomes quite apparent that the shadow is in the shape of a large, old, wooden galleon. And peering through the mist, as if directly at you, an old, tattered, Jolly Rodger. The decaying vessel which once ferried a pirate crew of hundreds to plunder and fortune, crashes onto the beach.

Perhaps because you have had too many beach martinis, you chose to investigate. You come across a massive treasure chest, its rusted, half open, lock inviting you to take a look inside. The lock breaks off with ease and the chest emits a massive creaking sound as you raise the lid, as if crying out in pain.
A column of black smoke rises immediately from the open chest and billows out over the entire island! You duck to the floorboards and hold your breath but inevitably inhale some of the smoke.
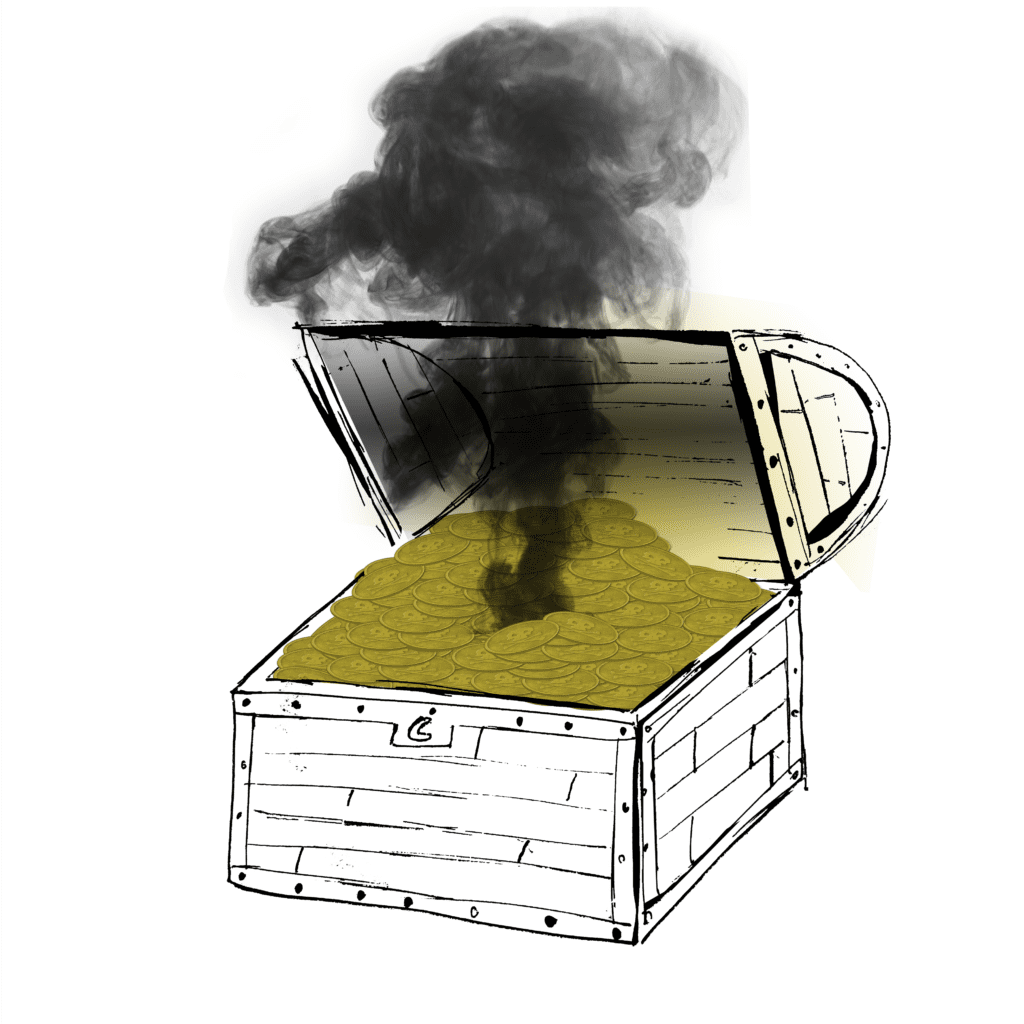
As the fumes dissipate you gaze upon your reward, a chest full of bright, shiny, gold doubloons! And on top of them, a note on an old parchment that reads:
“To acquire this treasure, all abroad this ship agreed to sell their souls. There is now a curse upon this treasure and this land! The black smoke will curse all who come into contact with it, with a success rate of 1%! The cursed will become plague carriers, bursting into smoke at the stroke of midnight, and allowing the curse to expand further until the whole world is consumed! Is the price of your greed worth as such? Each cursed walker is now a part of my crew and may walk away from this ship carrying any treasure, but those who are not part of my crew will find the treasure burns red hot and will find it quite impossible to depart with any doubloons. True, some may not be cursed but have pirate blood in their ancestry or other such factors which may fool the test allowing them to escape with some treasure despite not being a cursed member of my crew, but most of the time they cannot abscond with any treasure. This test is 98% accurate, so don’t try any funny business!”
So, 1% is pretty negligible, you guess, must have been a pretty weak demon or sorcerer. Nonetheless, there is now an island full of people infected by the curse. Luckily, you have a nearly foolproof way to detect the cursed individuals! Simply get everyone one the island to attempt to carry away a piece of treasure. If it does not glow red hot, they are a member of the crew and therefore cursed!

Everyone on the island lines up to take the test, and one by one they grasp a gold coin and attempt to remove it from the pile. Most of the time, the coin burns their skin, and they drop it, crying out in pain however feeling relieved! They are not cursed by the pirates of the damned!
As you grab the coin and begin to hold it a lot a funny thing happens, or rather, does not happen. There is not pain, no red glow, no hot metal. You are free to take the gold as you please. Horrified, you soberly tally the odds. The test is 98% accurate, therefore, there is a 98% chance that you are cursed, all hope seems lost!
But hark! A ghost walking over the waves approaches you (first cursed pirates and now bleedin’ ghosts!) Why, it’s the ghost of famous mathematician Thomas Bayes! And he tells you that though the situation is indeed dire, there may be hope for you yet. As the chance that you are cursed is not, in fact, 98%, but only 33%!
I used four ranges for the experiment, though you could do it using less. The first range I will name POPULATION and it will consist of cells A1 to J1000. This will hold both the population values as well as their test values. The next range I will call ACTUAL and will hold the actual value informing us whether or not that individual is infected. This range consists of cells L1 to U1000. The third range I will call TEST and this holds the results of the test for each individual. This range is cells W1 to AF10000. The fourth range I will call COMPARE and consists of cells
To make the population of ten thousand in range POPULATION is very easy. Simply create a range from row 1 to 1000 and from column 1 to 10 and fill the entire range with 0’s, representing 10,000 healthy people. Next, drop the following lines of code in the code editor:
Sub CreatePopulation()
acc = 0
For r = 1 To 1000
    For c = 1 To 10
        acc = Int((100 - 1 + 1) * Rnd + 1)
        If acc <= 90 Then
            Cells(r, c).Value = "0"
        Else
            Cells(r, c).Value = "1"
        End If
    Next c
Next r
End Sub
They work as follows:
The outer loop will run from row 1 to row 1000. The inner loop will loop from column 1 to 10. This will create 1000 rows or 10 columns for a total of 10,000 cells. If creating a population where every individual is uncursed, simply set each cell’s value equal to “0”. When creating a population with a curse rate of 1%, do a check before entering data into the cell. Take a random number between 1 and 100 and if the number is less than or equal to 99, then enter a “0”, if, however, the random number is 100, then enter “1”, they are cursed!
Running this code will create a range of roughly 9,900 0’s and about 100 1’s. That is the population of the island after the curse has infected about 1% of the people.
The next macro tests to see if the individual is cursed or not, whether they could take the coin or not. This code loops the same way, row from 1 to 1000, column from 1 to 10, and performs a random check in the exact same fashion, this time using a random number between 1 and 100 and triggering a false reading if the number is not less than or equal to 98 as the test is 98% accurate. If the test is successful, the result of the test will equal the value in the cell. I separated them using a “.” So the macro enters “.” Plus the original value in the cell. Meaning a non-cursed person with a negative test will be “0.0” and a cursed person with a positive test will be “1.1”. If the test fails, as it should about 2% of the time, simply put the opposite result after the “.”. In the case of a non-cursed person the result will be “0.1” and in the case of a cursed person the result will be “1.0”.
Sub TestPopulation()
acc = 0
For r = 1 To 1000
    For c = 1 To 10
        acc = Int((100 - 1 + 1) * Rnd + 1)
        If acc <= 96 Then
            Cells(r, c).Value = Cells(r, c).Value & "." & Cells(r, c).Value
        Else
        If Cells(r, c).Value = "1" Then
            Cells(r, c).Value = Cells(r, c).Value & ".0"
        Else
            Cells(r, c).Value = Cells(r, c).Value & ".1"
        End If
        End If
    Next c
Next r
End Sub
After running the test the range should look something like this:
The experiment is now complete, all that remains is to test for the accuracy and see if it does indeed match the theory. And to achieve this, simply split each cell value at the “.” and compare the left and the right side.
Range ACTUAL will hold the real values and this is achieved by populating it with an equation. I used the equation “=LEFT([cell],1)” which will take the first character from the left of the cell. In range TEST I put the RIGHT equation “=RIGHT([cell],1)”. Now the range ACTUAL holds the actual value from the population while range TEST holds the test results.
To see the actual, real and true, number of cursed, simply count the number of 1’s in the ACTUAL range using =COUNTIF(L1:U1000,”1″).
Similarly, to get the number of cases who tested positive, count the number of 1’s in range B using =COUNTIF(W1:AF1000,”1″)
Finally, compare the number of people who are actually cursed to the number of people who tested positive for the curse in the following way:
There are two types or errors. The first type is called a “Type 1” error or sometimes, more specifically, a false positive. This happens when the test chosen returns a positive result despite the individual actually being negative for the disease. In the larger statistics context, a type 1 error is rejecting the null hypothesis when in reality it should not have been rejected.
The second type of error is a “Type 2” error and is sometimes called a false negative. A type 2 error happens when the test results is negative despite the person actually having the disease. More broadly, it is the failure to reject the null hypothesis when it should have been rejected.
To get the number and types of errors, the following equation is useful:
=IF(L1=W1,”T”,IF(L1=”1″,”Type 2″,”Type 1″))
I used that equation to populate the COMPARE range. First, compare the ACTUAL and TEST values for a given individual using IF L1=W1, if they are equal then the test was successful, have Excel enter “T” for true. If they are not equal then the test was inaccurate, use a nested IF statement to determine the error type. If the ACTUAL was positive then it is a type 2 error, a false negative, because range ACTUAL holds a 1 and TEST holds a 0. Have Excel enter “Type 2” otherwise it must be a type 1 error, so have Excel enter “Type 1”.
Here are some screenshots of that process showing the equations:

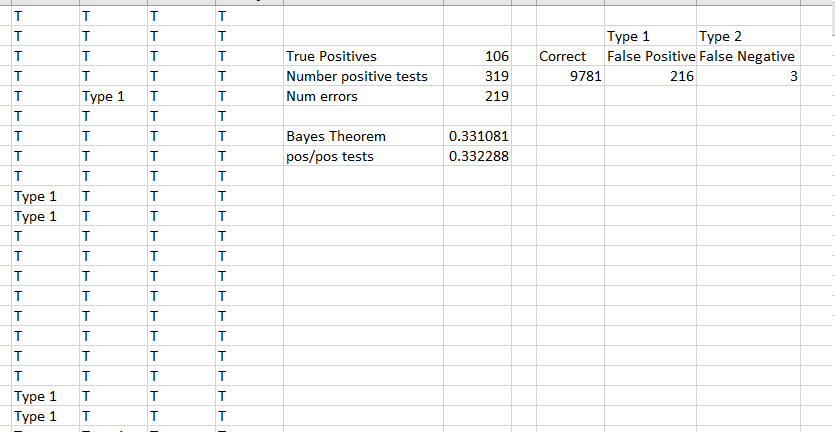
And the results:
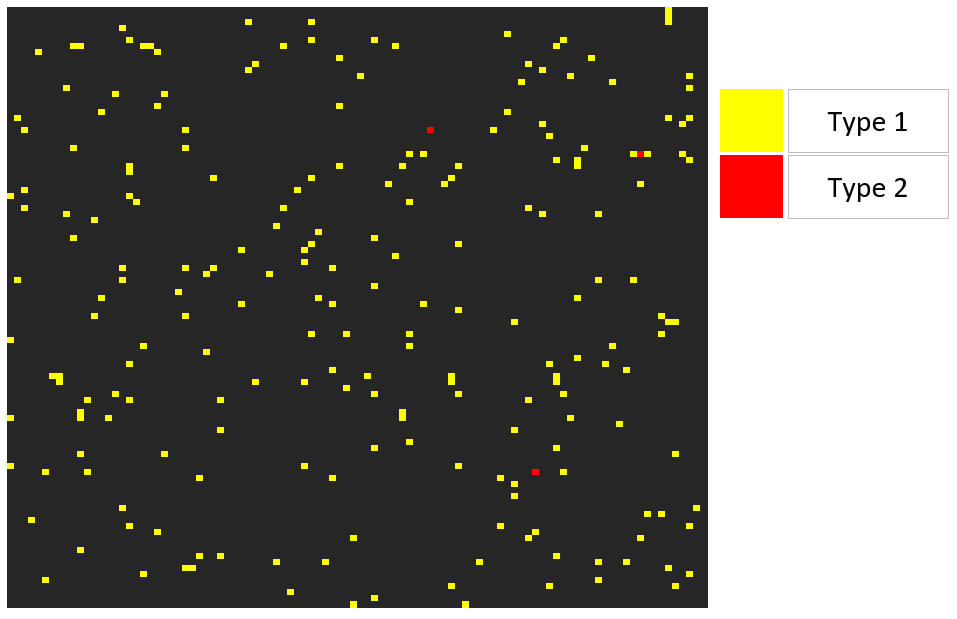
And a nice heat map of the errors and types.
After gathering all the data it should be easy to calculate the accuracy. Count the number of 1’s in the ACTUAL range, which is 106 in this case, and calculate the number of 1’s in the TEST range, which I have as 319. The chances that you test positive and ARE positive are:
106/319 = .3322%
So there is still only a roughly 33% chance that you are infected after a positive test result.
Theory
This application of Baye’s Theory can be derived from the definition of conditional probability. Conditional probability is the idea that something may have a higher chance of happening given another event. For example, you can count all of the people walking around carrying umbrellas and you can count how often it rains in a given year. Then you can estimate the overlap, how likely is it that someone is carrying an umbrella, event A, given that it is raining, event B. The formula for conditional probability is below, what is the probability of event A given event B:
![]()
Likewise for event B given event A:
![]()
Taking the second equation and multiplying by P(A):
![]()
Then substitute the expression into the first equation for conditional probability:
![]()
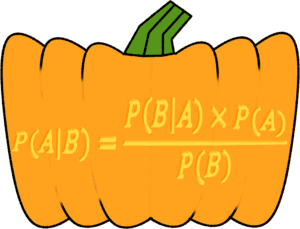
Bayes Theorem now gives us this:
![]()
The probability that someone tests positive given that they are cursed is equal to the accuracy of the test, 98% in this case. The probability that they are cursed is 1% in this example. The denominator, the probability of testing positive, requires a bit more work.
What is the probability that they test positive? To calculate the denominator multiply the chance that they test positive times the chance that they are positive then add the chance that they don’t test positive times the chance that they are not positive. That value gives the probability used in the denominator and luckily we have all of those values thanks to the kind note written by the cursed pirate (in actual, real life, these values can be derived from testing in controlled environments).
![]()
Plugging all of that in reveals something called the Positive Predictive Value (PPV) of .331 which is interpreted to mean that if a person tests positive for the curse they have a 33% chance of actually being cursed.
![]()
Rearranging the heat map reveals why this is the case. Placing at the top left all of the cursed individuals, and overlaying all of the positive test cases, it becomes obvious that the number of positive tests outnumber the amount of actual positive individuals by a large amount.

Finally, compare the theoretical prediction to the results of the experiment:
| Theoretical PPV: 0.331081 | Experimental Result: 0.332288 |
In summary, after the ghost of Bayes revealed a shocking prediction, we ran an experiment in Excel and found that the results matched the prediction. After seeing the numbers emerge in the experimental setting, we explored the theory and found that they do indeed match. Even for an island with a relatively small population of 10,000.
Happy calculating, happy Halloween, and watch out for any ghosts of mathematicians or cursed pirates. ‘Tis the season!