日本語の場合は、上隅にある旗をクリックして「日本語」を選択します
Think of this as something like a gardening simulator in Excel. Using random numbers we will grow a plant from a flower pot on a sheet. This will cover a variety of Excel topics including the proper VBA syntax for: RGB colors, cell borders, color gradients, random number generators, and there will also be some data validation as well.
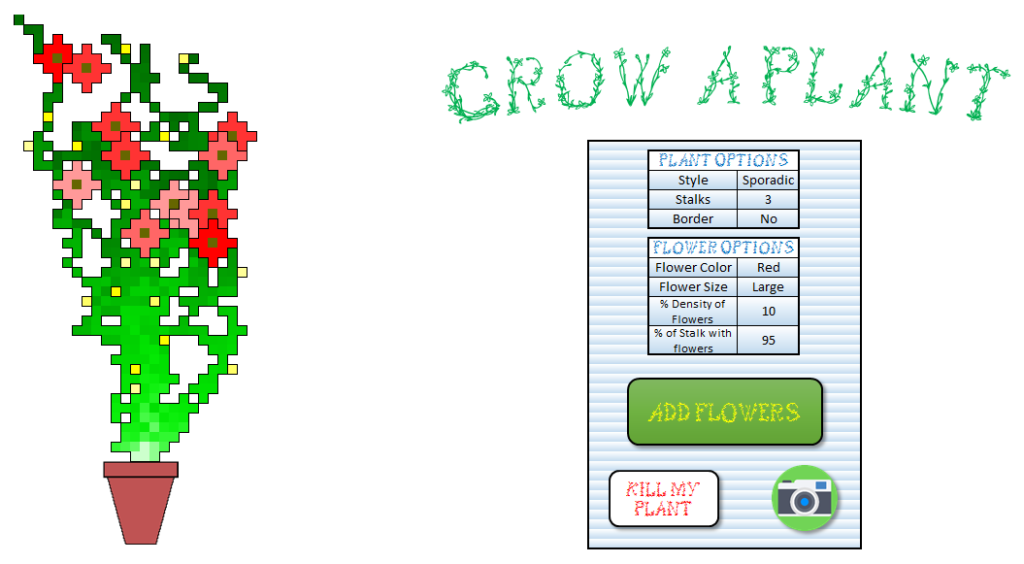
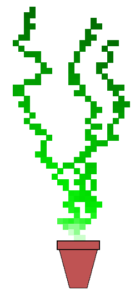
This is what the final version of the project should look like:
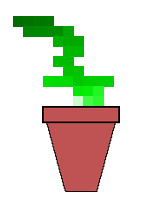
But it all starts with an empty flower pot…

(Seems a little lonely…)
…and by clicking on it, some type of plant will grow. The style and variety will be influenced by user inputs as well as random chance, we are growing a plant after all and nature is never very exact. There are a few key inputs from the user that will alter how the plant grows and what type of flowers bloom from it. These inputs are plant style, number of stalks, and if the user wants a border around them. The next options relate to the types of flowers, the user can select flower size, flower color, flower density, and what percentage of the stalk should be allowed to grow flowers. Lets take an in depth look at how this plant actually grows and how the user inputs alter it.
First things first, as always her is a brief run down of how my sheet is styled and set up. The growing area will be range A1 to AZ57. I decided using 10 by 10 pixel cells so the rows and columns had to be adjust accordingly, this size corresponds to a column width of 0.83 and a row height of 7.5. All the cells in the growing area should not be filled with any color and you should turn off gridlines so everything looks cleaner. To do that, select the cells in the growing area, click on the paint can drop-down and select “No fill” then click on “View” in the ribbon and uncheck the box marked “Gridlines.” I made a flower pot in GIMP and positioned it so that cell AA46 is just above the center of it, that is where the plant will start growing. Off to the right is the control center where the user will be able to alter the various attributes of the plant. To make these cells looks proper and to avoid text being cut off you will need to merge a few cells because the rows are so short but that is easy. Just select the cells you would like to merge into one, right click, go to alignment and check the box next to “Merge Cells” and all the selected cells will behave as one cell, the top left cell will become the merged cell’s address. See the above image to get an idea of how I set this up and what it can look like.
All the inputs are in column BG and I split them into two categories, stem options and flower options. This is part one where we will handle building the stem options, in part 2 we will look at the flower options. Anyway, there are three options for stem: “Style,” “Stalks” (for the number of stalks that will be grown), and “Border.” There should be four cells to handle the four options for growing flowers so mark these as “Flower Color,” “Flower Size,” “Flower Density (this relates to how many flowers will grow on a stem), and “Percentage of Stalk with Flowers (this means that the user can opt to have flowers grow only on a portion of the stem, only near the top for instance).
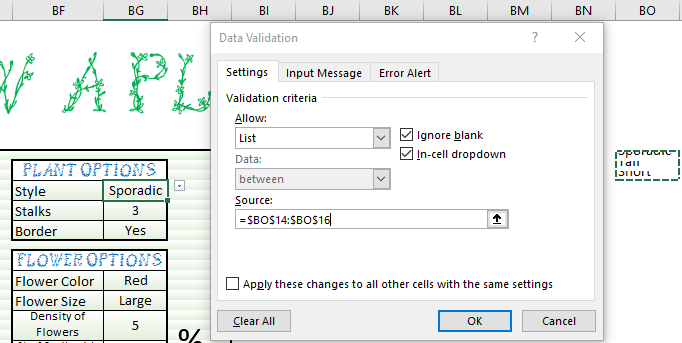
This is where data validation will become important. The program to grow stems and flowers will be looking for very specific inputs and if the user were to type them in wrong or make a small error then the program will not run properly. To avoid this I used drop down menus so that the user selects the options from a list, ensuring that the inputs will always be correct. Excel makes this very easy. For stem style there will be three options. I wrote those options in three cells over in a column to the right. Select the cell you want to have the user enter data into, for instance, I selected cell BG17 which is next to the label “Style”. Then simply click on the data tab on the ribbon, click on data validation and a window will pop up. Go to the drop-down menu under the word “Allow” and select “list.” Check the box by “Ignore blank” and also check “In-cell dropdown.” There will be a box below titled “source” click in it and then select the cells holding the data you wish to be available in this drop-down menu. For me, I selected the three cells containing the type of stem style that I had typed in a column off to the right. Now the user can select whichever plant style they desire by utilizing the drop-down menu and we won’t have to worry about spelling errors in the VBA code we write. I also hid the column holding the data just to make it a little more protected. I hope this screenshot provides a nice summery of how to set up that data validation:
I did the exact same for the Yes and No options next to “Border” as well as some of the flower inputs but that will be covered in the next blog.
You can color the cells around the user inputs and add borders and what-not. I then added three buttons. One runs the flower program which makes flowers bloom on the stalk, the other kills the plant, allowing the user to start over, and the camera button saves the plant as an image on another tab so the user can create many different kinds and save the best ones.
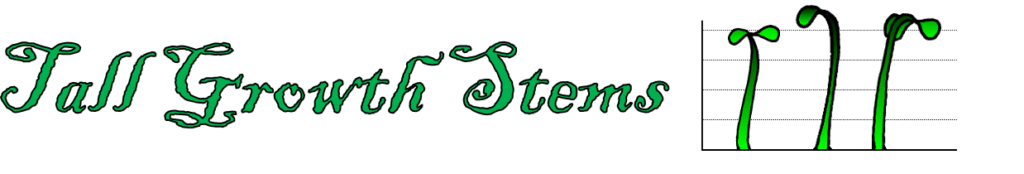
I added a title using this font which matches the theme of the project quite nicely. You can download the font for personal use for free but I have no right to distribute it here. If you do not have that font installed and you open the spreadsheet I embedded below, it will use the default font installed on your PC.

Flowers and plants are often beautiful, vivid, and colorful things and the plants grown here will be no exception. Therefore, it is worth taking a moment to understand the basics of the RGB color model used by many electronic devices (such as computer screens) because we will be manipulating those colors for this project. Many digital screens use an additive color scheme to represent colors and red, green, and blue are excellent primary colors for that. RGB stands for Red Blue Green and each of those will take on a value from 0 to 255, the higher the value, the greater the intensity of the color. A good analogy is pointing a colored flashlight at the wall, at 255 the light is at its brightest, at 0 there would be no light from the flashlight all. If all three of those color values are at 0 then you get the color black. If you turn all three lights up to maximum and shine them on the same spot it would become very bright and you would achieve the color white.
With all that in mind, suppose you shine a green flash light at a wall and turn the intensity up to 255 but you don’t shine any other light at the wall. You would see a true green. As you turn the intensity down it will be the same green except it will grow darker in shade as the light fades. Turn it back up to 255, now, if you want a lighter shade of green you need to add more light. Adding red light of the same intensity will mix with the green light and the color on the wall will turn into a yellow, swapping red for blue turns the color cyan. Adding in the exact same amount of red and blue but at a lower intensity than green will keep the same hue of green while increasing the shade because it is adding more light onto the wall. Later in this project you will be able to see the interplay of the color variables and the hues and shades they produce. Here is a nice image I found that should help elucidate the concept:


The plant will start with a single stem growing from the center of the flower pot, in my case this is cell AA46. What happens next is that the stem grows outward and the plant will grow into an adjacent cell determined at random, there is also a chance that it will decide to stay in the starting cell but that is unlikely though still possible and permissible. To determine the next cell, generate a random number between -1 and +1 to be used as the row offset variable and do the same except for the column offset variable. I simply used the Offset method you can see below. Candidate cells for stem growth are as follows :
Cell.Offset(RowVariable, ColumnVariable)
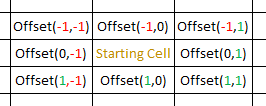
Then set the starting cell equal to the new cell and iterate again, generating new row and column offset variables each time.
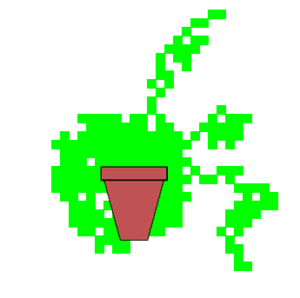
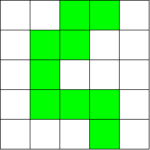
However, I want my plant to only grow out or upwards, therefore I will not allow the row variable to take the value of positive 1. This ensures that the stem never grows down, by not adding this restriction the plant would have and equal chance of growing up or down and almost always end up as some type of circular blob, as seen below.
Finally, to keep the stem in play and to avoid crashing the program I added three lines of code. All they do is say that if the row variable dips below 1 then to force it back up to 1. The same goes for the column variable except there is a left and a right border for the growing area so the column variable must stay greater than 1 and less than 53. Those lines can be seen toward the bottom of this code block.
Sub Grow
Randomize
start1 = 46
start2 = 27
y = 1
Cells(start1, start2).Interior.ColorIndex = 4
Do Until y > 75
r = Application.WorksheetFunction.RandBetween(-1, 0)
c = Application.WorksheetFunction.RandBetween(-1, 1)
Cells(start1, start2).Offset(r, c).Interior.ColorIndex = 4
start1 = Cells(start1, start2).Offset(r, c).Row
If start1 <= 1 Then start1 = start1 + 1
start2 = Cells(start1, start2).Offset(r, c).Column
If start2 <= 1 Then start2 = start2 + 1
If start2 >= 52 Then start2 = start2 – 1
y = y + 1
Loop
End Sub
The above code will get more complicated when newer features are added but this is the basic method for how the stem grows and is colored in. To recap what the above code is doing: the starting point is always a set position, cells(46,27), and we have the cell colored green. We will then make the stem grow 75 times before it is fully mature, each time it grows we generate a new row variable which is randomly selected to be either -1 or 0. If r is -1 then the stem grows up one row towards the sun, if it is 0 then stem won’t grow up but could still grow out. The column variable has slightly more options, this will be a random number between -1 and +1. A -1 means the stem grows to the left one cell, a 0 means it does not grow out at all (but it may still grow up by one), and a +1 means it grows out by one cell to the right. Once the stem has its next desired location to grow into, the new location is painted green and the new cell’s address becomes the new starting point which is why we set the row variable, start1, to the row of the newly painted cell and also why start2 is set to the new cell’s column value.
We are ready to grow our first plant! Right click on the flower pot and select “Assign Macro.” Assign it to macro “grow.” Now, Click on the flower pot and voila!
(Slowed down for dramatic effect)

The stem looks pretty good, and it certainly seems to grow naturally, but the uniform color is just not quite what we are looking for. What I want to see is a plant that is lighter at the base and grows darker as it matures. It turns out that this isn’t that complicated to design, here’s how it can work. First, instead of using Interior.ColorIndex use this syntax: Interior.Color = RGB(RedValue, GreenValue, BlueValue) and the three color values can be variables which is extremely important here. Set the three color variables to the initial desired color, for me this is a very light green:
green = 255
red = 204
blue = 204
Change the starting color from the color index value of 4 to the new RGB syntax:
Cells(start1, start2).Interior.Color = RGB(red, green, blue)
And make the most important changes inside the loop:
Cells(start1, start2).Offset(r, c).Interior.Color = RGB(red, green, blue)
green = green – 2
red = red * 0.7
If red < 0 Then red = 0
blue = blue * 0.7
If blue < 0 Then blue = 0
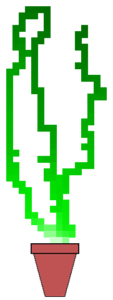
After each iteration, subtract a small number off of the green color variable which makes green less intense and therefore darker. Also, decrease the value of both red and blue with every iteration by the same amount, I chose 30% each time. By subtracting the same amount from the red and blue color variables the hue will stay the same green but the shade will decrease as the plant grows. Keep in mind that if you decide to decrease the color values by simple subtraction they will cause an error if they drop below 0 but that is a simple fix. Just add the line “if red < 0 then red = 0”. I could do this for green but since I am only running 75 iterations and subtracting 2 each time I will never run out of green (255 – (75 * 2) = 105). The plant stem now looks far more interesting:

The plan is to add an optional border around the stem later but for now it looks beautiful if not a little lonesome. There should be a way to add more stems to really fill out this plant. Of course, the user can keep clicking on the pot and more stems will grow but, as you will see, this may mess up how the user wants the plant borders to look. Instead, put the entire stem growth loop inside another loop and make it run over as many stems as you like. For instance, if the user desires 3 stems they will indicate that by entering a 3 in the input area in cell BG19. Set a new variable, mine is called loopers, equal to the value in that range and loop until loopers is greater than said value:
Sub Grow
Do Until loopers > Range(“BG19”)
‘stem growth program
Loopers = loopers + 1
Loop
End Sub
Gorgeous! I call those types of stems “Sporadic Growth Stems” and they are the default style but there are two other varieties I would like to create.
Under the sporadic method the stem can grow in a pattern like this:
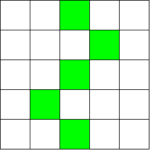
Which is certainly wild and untamed, but what if we desire a little more of a timid plant, one that can’t jet off in any direction with reckless abandon? One that can only move in patterns like this:
This pattern forces each stem segment to connect to the previous one by at least one whole segment side resulting in an overall different looking plant. Both varieties are rather cool so the user should have the option of choosing sporadic or tall. Here is how to program it into the main stem growth loop using only three additional lines, which are placed immediately after generating a random r and a random c:
If Range(“BG17”) = “Tall” Then
If r = -1 Then c = 0
End If
What the above code does is this: if the user has selected tall then check to see what the r value is. If r is -1 then the plant will be growing upwards and therefore we cannot allow it to also grow outwards, otherwise we could end up with a scenario like under sporadic growth. What is crucial to note is that this system is entirely based on what the r value is and 50% of the time r will be -1 leading the plant upward. So half the time it will grow upwards, about 16.66% of the time it will grow to the left, about 16.66% of the time it will grow to the right, and about 16.66% of the time it will not grow into a new cell at all. These numbers result in a tall and thin looking stem:

Notice at the top the plant wants to grow both up and left but in order to do so must take a much broader zip-zag motion than before. What were to happen then, if we slightly altered this new system so that the column variable were given preference over the row variable?

Here is an example of a short growth stem:
Short assumes the same growing philosophy as that of tall but reverses directional priorities. Add these lines underneath the “if/then” lines handling the tall growth stem option:
If Range(“BG17”) = “Short” Then
If c = 1 Or c = -1 Then r = 0
End If
The difference here is that if it has been determined that the plant wants to move in a sideways motion then we cannot allow it to also move in an upwards motion. And in this scenario the percentages are different, there is a 66% chance of the plant wanting to move sideways and therefore it will only be allowed to grow upwards 33% of the time. However, whether or not it actually grows upwards is a 50/50 chance meaning that, once you crunch all the numbers, this plant has about a 16.66% chance or growing upwards making this a short plant indeed. At 75 iterations, you should grow an average of 12.5 cells per plant stem. Please note that because we were clever with how we wrote the color changing scheme, the plant still matures, it is just a type of short plant. Finally, if neither tall not short are selected the code will run on the default setting which is for sporadic growth.

This is the final addition to the stem program for part 1 of this two-part blog. Both bordered and non-bordered plants can look good and the user should have the option of which one to choose. The border should be the last thing that the program adds to the stem so at the very end of the routine “grow” check to see if the user desires to have a border and if they do call the subroutine that handles that operation. I called mine “findbordr” for “find the right border.”
If Range(“BG21”).Value = “Yes” Then
Call findbordr
End If
There are two important terms I must introduce here. The symbols “<>” placed like that mean “is not equal to.” Also, if a cell has no color, not even white (though it will still appear white on the sheet) then the interior is said to be = xlNone. To determine if a border needs to be in place all the program has to do is check the cells around the current cell. The syntax for placing said border is Cells(r, c).Borders(xlEdgeRight).LineStyle = xlContinuous, you can replace xlEdgeRight with xlEdgeLeft, xlEdgeTop, or xlEdgeBottom and those should be pretty self-explanatory. LineStyle can take on different values but I won’t get into that here, I just used a standard border.
Here is the train of logic for determining what needs a border and where: if the current cell is empty, meaning Interior.Color = xlNone, then no borders are needed. Move on to the next cell. If the current cell is not empty, meaning that Interior.Color <> xlNone, then there is a stem there. The next step is to determine if the current cell is in column 1, the leftmost extreme column. If c = 1 then there can be no cells to the left that have stems because there are no cells to the left. Place a border on the left side of the cell in this scenario. If the current cell has a stem and c <> 1 then check the cell to it’s immediate left using the Offset method relied so heavily upon in this project. If the current cell has a stem and the cell to its left does not then place a border on the left side of the cell. If the current cell has a stem and the cell to the right does not then place a border on the right side of the cell. If the current cell has a stem and the cell to the right also has a stem do not place any right-side borders and continue moving across the columns until you find a cell that is the right-hand border of the plant stem. Place the right-side border there. Do this across the entire growing area so check each cell from columns 1 to 52 and in each row until row > 46, the plant can’t grow down and so there will never be any stems found below the pot. Once r reaches 47 we can stop looking. The following VBA code does all of that for us:
Sub findbordr()
r = 1
c = 1
Do Until r > 46
If Cells(r, c).Interior.ColorIndex <> xlNone Then
If Cells(r, c).Offset(0, 1).Interior.ColorIndex = xlNone Then
Cells(r, c).Borders(xlEdgeRight).LineStyle = xlContinuous
End If
If c = 1 Then
Cells(r, c).Borders(xlEdgeLeft).LineStyle = xlContinuous
c = c + 1
End If
If Cells(r, c).Offset(0, -1).Interior.ColorIndex = xlNone Then
Cells(r, c).Borders(xlEdgeLeft).LineStyle = xlContinuous
c = c + 1
Else:
c = c + 1
If c > 52 Then
c = 1
r = r + 1
End If
End If
Else:
c = c + 1
If c > 52 Then
r = r + 1
c = 1
End If
End If
Loop
Call findbordt
End Sub
The exact same routine is then performed except this time it is the upper border that needs to be placed. Canvas the growing area again, evaluating each cell. If it is empty move along, if it is not empty then check the cell above and below it. If the cell above is empty, place a top border on the current cell. If the cell below is empty place a bottom border on the current cell. This routine also starts in row two, the reason being that if r = 1 then offset(-1,0) doesn’t exists and the program will crash. We can avoid that scenario entirely by starting in row 2 and if a bottom border is required on a stem segment in row 1, then this program will place a top border on the cell below it and they are exactly equivalent. Here is findbordt:
Sub findbordt()
r = 2
c = 2
Do Until r > 46
If Cells(r, c).Interior.ColorIndex <> xlNone Then
If Cells(r, c).Offset(1, 0).Interior.ColorIndex = xlNone Then
Cells(r, c).Borders(xlEdgeBottom).LineStyle = xlContinuous
End If
If Cells(r, c).Offset(-1, 0).Interior.ColorIndex = xlNone Then
Cells(r, c).Borders(xlEdgeTop).LineStyle = xlContinuous
c = c + 1
Else:
c = c + 1
If c > 52 Then
c = 1
r = r + 1
End If
End If
Else:
c = c + 1
If c > 52 Then
r = r + 1
c = 1
End If
End If
Loop
End Sub
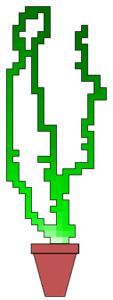
Now the user can select if they want a nice border around the plant, certain plants may require different looks and this gives the user a little more control. You can see the difference for yourself below:
Now we can grow three different variety of stems in any number we like and choose whether or not they look better with a border. In the second post we will have a look at adding flowers and all the various sizes and colors that go with them.
Spreadsheet below
Paste this code into a VBA module:
Grow a Plant VBA code
Dim tall As Integer
Dim red As Integer
Dim blue As Integer
Dim green As Integer
Sub grow()
green = 255
red = 0
blue = 0
loopers = 1
tall = 46
Do Until loopers > Range(“BG19”)
‘green = 204 ‘
green = 255
red = 204
‘blue = 0 ‘
blue = 204
Randomize
start1 = 46
start2 = 27
y = 1
r = 0
Z = 0
c = 0
Cells(start1, start2).Interior.Color = RGB(red, green, blue)
Do Until y = 75
r = Application.WorksheetFunction.RandBetween(-1, 0)
c = Application.WorksheetFunction.RandBetween(-1, 1)
If Range(“BG17”) = “Tall” Then
If r = -1 Then c = 0
End If
If Range(“BG17”) = “Short” Then
If c = 1 Or c = -1 Then r = 0
End If
Cells(start1, start2).Offset(r, c).Interior.Color = RGB(red, green, blue)
‘green = green * 0.98 ‘
green = green – 2
‘red = red * 0.98 ‘
red = red * 0.7
If red < 0 Then red = 0
‘blue = 0 ‘
‘blue = blue * 0.99 ‘
blue = blue * 0.7
If blue < 0 Then blue = 0
‘If r = -1 Then
‘End If
start1 = Cells(start1, start2).Offset(r, c).Row
If start1 <= 1 Then start1 = start1 + 1
start2 = Cells(start1, start2).Offset(r, c).Column
If start2 <= 1 Then start2 = start2 + 1 If start2 >= 52 Then start2 = start2 – 1
y = y + 1
If start1 < tall Then tall = start1
Range(“CH16”).Value = tall
Loop
loopers = loopers + 1
Loop
If Range(“BG21”).Value = “Yes” Then
Call findbordr
End If
End Sub
Sub findbordr()
r = 1
c = 1
Do Until r > 50
If Cells(r, c).Interior.ColorIndex <> xlNone Then
If Cells(r, c).Offset(0, 1).Interior.ColorIndex = xlNone Then
Cells(r, c).Borders(xlEdgeRight).LineStyle = xlContinuous
End If

If c = 1 Then
Cells(r, c).Borders(xlEdgeLeft).LineStyle = continuous
c = c + 1
End If

If Cells(r, c).Offset(0, -1).Interior.ColorIndex = xlNone Then
    Cells(r, c).Borders(xlEdgeLeft).LineStyle = xlContinuous
    c = c + 1

Else:
    c = c + 1
    If c > 52 Then
        c = 1
        r = r + 1
    End If
End If
Else:
c = c + 1
If c > 52 Then
r = r + 1
c = 1
End If
End If
Loop
Call findbordt
End Sub
Sub findbordt()
r = 2
c = 1
Do Until r > 50
If Cells(r, c).Interior.ColorIndex <> xlNone Then
If Cells(r, c).Offset(1, 0).Interior.ColorIndex = xlNone Then
    Cells(r, c).Borders(xlEdgeBottom).LineStyle = xlContinuous
End If

If Cells(r, c).Offset(-1, 0).Interior.ColorIndex = xlNone Then
    Cells(r, c).Borders(xlEdgeTop).LineStyle = xlContinuous
    c = c + 1
Else:
    c = c + 1
    If c > 52 Then
        c = 1
        r = r + 1
    End If
End If
Else:
c = c + 1
If c > 52 Then
r = r + 1
c = 1
End If
End If
Loop
End Sub
Sub flower()
b1 = xlEdgeLeft
b2 = xlEdgeTop
b3 = xlEdgeRight
b4 = xlEdgeBottom
Pi = 4 * Atn(1)
x = Pi / 2
y = x
u = b1
Z = 1
If Range(“CD29”).Value = “Large” Then
Call flowerlarge
ElseIf Range(“CD29”).Value = “Small” Then
‘If Range(“CD29”).Value = “Small” Then
Call flowersmall
Else
Height = (46 – tall) * ((Range(“BG33”).Value) / 100) + tall
‘Height = Range(“CH18”).Value ‘ + Range(“CH18”).Value
r = 2
c = 2
Do Until r > Height
density = (100 – Range(“BG30”).Value) / 100
If Cells(r, c).Interior.ColorIndex <> xlNone Then
rando = Rnd
If rando > density Then
Call colory
addy1 = Cells(r, c).Offset(-1, -1).Address
addy2 = Cells(r, c).Offset(1, 1).Address
midpoint = Cells(r, c).Address
Range(addy1, addy2).Interior.Color = RGB(red, green, blue)
With Range(addy1, addy2)
.Borders.LineStyle = xlLineStyleNone
.Interior.Color = RGB(red, green, blue)
.BorderAround xlContinuous
End With
If Range(“CD29”).Value = “Large” Then
Do Until Z > 4
r2 = Round(Cos(y)) * 2
c2 = Round(Sin(y)) * 2
Cells(r, c).Offset(r2, c2).Interior.Color = RGB(red, green, blue)
Cells(r, c).Offset(r2, c2).BorderAround xlContinuous
If Z = 1 Then u = b1
If Z = 2 Then u = b2
If Z = 3 Then u = b3
If Z = 4 Then u = b4
Cells(r, c).Offset(r2, c2).Borders(u).LineStyle = xlNone
y = y – x
Z = Z + 1
Loop
Z = 1
End If
Range(midpoint).Interior.Color = RGB(102, 102, 0)
End If
End If
c = c + 1
If c > 50 Then
r = r + 1
c = 2
End If
Loop
End If
End Sub
Sub kill()
tall = 46
With Range("A1", "AZ100")
    .Interior.Color = xlNone
    .Borders.LineStyle = xlLineStyleNone
End With
End Sub
Sub flowerlarge()
Pi = WorksheetFunction.Pi
x = Pi / 2
y = x
r = 3
c = 3
‘Height = Range(“CH18”).Value ‘ + Range(“CH18”).Value
Height = (46 – tall) * ((Range(“BG33”).Value) / 100) + tall
Do Until r > Height
density = (100 – Range(“CD27”).Value) / 100
If Cells(r, c).Interior.ColorIndex <> xlNone Then
rando = Rnd
If rando > density Then
Call colory
addy1 = Cells(r, c).Offset(-1, -1).Address
addy2 = Cells(r, c).Offset(1, 1).Address
Range(addy1, addy2).Interior.Color = RGB(red, green, blue)
With Range(addy1, addy2)
.Borders.LineStyle = xlLineStyleNone
.Interior.Color = RGB(red, green, blue)
.BorderAround xlContinuous
End With
Cells(r, c).Interior.Color = RGB(102, 102, 0)
Do Until y < -Pi
r2 = Round(Cos(y)) * 2
c2 = Round(Sin(y)) * 2
Cells(r, c).Offset(r2, c2).Interior.Color = RGB(red, green, blue)
Cells(r, c).Offset(r2, c2).BorderAround xlContinuous
If y = Pi / 2 Then u = xlEdgeLeft
If y = 0 Then u = xlEdgeTop
If y = -Pi / 2 Then u = xlEdgeRight
If y = -Pi Then u = xlEdgeBottom
Cells(r, c).Offset(r2, c2).Borders(u).LineStyle = xlNone
y = y – x
Loop
y = Pi / 2
End If
End If
c = c + 1
If c > 49 Then
r = r + 1
c = 3
End If
Loop
End Sub
Sub flowersmall()
r = 1
c = 1
‘Height = Range(“CH18”).Value ‘ + Range(“CH18”).Value
Height = (46 – tall) * ((Range(“BG33”).Value) / 100) + tall
Do Until r > Height
density = (100 – Range(“CD27”).Value) / 100
If Cells(r, c).Interior.ColorIndex <> xlNone Then
rando = Rnd
If rando > density Then
Call colory
If c = 1 Then
L = 0
Ri = 1
ElseIf c = 52 Then
L = -1
Ri = 0
Else
L = -1
Ri = 1
End If
randflower = Application.WorksheetFunction.RandBetween(L, Ri)
addy1 = Cells(r, c).Offset(0, randflower).Address
‘Range(addy1).Interior.Color = RGB(red, green, blue)
With Range(addy1)
.Interior.Color = RGB(red, green, blue)
.Borders.LineStyle = xlLineStyleNone
.BorderAround xlContinuous
End With
End If
End If
c = c + 1
If c > 52 Then
r = r + 1
c = 1
End If
Loop
End Sub
Sub savephoto()
Range(“A1”, “AZ57”).Copy
county = Sheets.Count
Sheets.Add(After:=Sheets(Sheets.Count)).Name = “Photo ” & county
With Sheets(“Photo ” & county)
.Range(“A1”).Select
ActiveSheet.Pictures.Paste
End With
Application.CutCopyMode = False
End Sub
Sub colory()
Randomize
randocolor = Application.WorksheetFunction.RandBetween(0, 4)
red = 51 * randocolor
green = 51 * randocolor
blue = 51 * randocolor
If Range(“CD23”).Value = “Blue” Then blue = 255
If Range(“CD23”).Value = “Red” Then red = 255
If Range(“CD23”).Value = “Green” Then green = 255
If Range(“CD23”).Value = “Purple” Then red = 255: blue = 255 ‘And blue = 255
If Range(“CD23”).Value = “Yellow” Then red = 255: green = 255 ‘And blue = 255
End Sub
Sub colotest()
‘tt = Range(“x31”).Color
MsgBox tall
End Sub